library(tidyverse)
library(janitor)
library(stringr)
library(dplyr)Analysis
This project aims to analyze environmental quality violations from the Texas Commission on Environmental Quality available publicly on Texas Open Data Portal. The goal is to understand which businesses in Texas get cited for environmental quality concerns, as well as when and where these violations occur.
Goals of this notebook
I will explore the following trends:
- Which entities/businesses received the highest number of environmental violations in Texas? Who stands out in Travis County?
- Which Texas county is home to the businesses responsible for the majority of environmental citations since 1998?
- Who received the most violations in Harris County - the top emitter?
- How have violation trends evolved since 2010, and what factors might explain their increase or decrease?
- Do the yearly trends differ in Greater Austin? If so, how?
- What are category A, B, and C violations, and what is their composition in the data?
- Which entity has the most category A violations, and what are they?
- Which industry receives the most environmental quality notices, and what specific issues are cited?
Set up & import
To accomplish my tasks, I am loading in a couple of handy packages.
This is also where I will import my cleaned data sets: nov_clean, which gives me information about the entity, and citation_clean, which gives me the other details (including the allegation descriptions).
The two data sets are linked by investigation numbers, which uniquely identify entities regulated by the TCEQ. Cross-referencing these allows you to identify specific allegations made against entities using the look-up tables created in the cleaning notebook.
Again, nov_clean is useful for the regulated entity name column.
nov_clean <- read_rds("data_processed/01-nov.rds")

nov_clean
# A tibble: 65,635 × 21
regulated_entity_number regulated_entity_name business_type physical_location
<chr> <chr> <chr> <chr>
1 RN101384659 CITY OF ROBY <NA> <NA>
2 RN105997860 CUTTERS LAWN AND LAN… <NA> 16 BEAR RUN
3 RN105993190 THE WOODLANDS LAWN A… <NA> 18 QUICK STREAM …
4 RN102979168 LUCKY FOOD MART RETAIL 807 BROWN ST
5 RN106001027 RAINBIRD DESIGN SERV… <NA> 2498 ROLL DR STE…
6 RN101835825 SPEEDY MART RETAIL 2050 BINGLE RD
7 RN105629703 TAN VIET POULTRY LIVE… 8914 COOKS RD
8 RN105601694 HAPPY FARM BROILER FARM 8916 COOKS RD
9 RN104795398 JOEY VUONG FARM <NA> 8209 OLD HWY
10 RN101187896 SUSAN CIRCLE COMMUNI… <NA> <NA>
# ℹ 65,625 more rows
# ℹ 17 more variables: physical_city <chr>, physical_state <chr>,
# physical_zip_code <chr>, county <chr>, investigation_number <chr>,
# investigation_approved_date <date>, nov_date <date>,
# coordinates_county_centroid <chr>, tceq_region <chr>,
# notice_of_violation_id <chr>, cat_a_violation_tracking_numbers <chr>,
# cat_a_violation_citations <chr>, cat_b_violation_tracking_numbers <chr>, …citations_clean, with a wider time frame from 1998, is useful for violation descriptions and resolutions.
citations_clean <- read_rds("data_processed/01-citations.rds")

citations_clean
# A tibble: 241,025 × 15
investigation_number investigation_approved_date notice_of_violation_id
<chr> <date> <chr>
1 2021703 2024-11-08 534344812024310
2 2022240 2024-11-08 360584652024304
3 2022445 2024-11-08 219368582024312
4 2015194 2024-11-08 399510332024303
5 2022467 2024-11-08 467347032024305
6 2022467 2024-11-08 467347032024305
7 2021304 2024-11-08 276390142024313
8 2010056 2024-11-08 695336872024313
9 2015194 2024-11-08 399510332024303
10 2018465 2024-11-08 110615902024310
# ℹ 241,015 more rows
# ℹ 12 more variables: violation_tracking_number <chr>,
# current_violation_status <chr>, violation_status_date <date>,
# violation_allegation <chr>, violation_resolution <chr>,
# violation_repeat_indicator <lgl>, compliance_due_date <date>,
# compliance_history_classification <chr>, violation_category <chr>,
# investigation_type <chr>, county <chr>, tceq_region <chr>Frequency by entity and county
I will use the group, summarize and arrange method to find basic information about the data, including which entities and counties have the most violation citations. My takeaways will reference both data sets and the category memo sent to me by the TCEQ information officer.
First, I will group the entities, sum up their total violations from a separate column, and include the counties and investigation numbers for further research.
entity_count <- nov_clean |>
  group_by(regulated_entity_name, county) |>
  summarize(
    total_violations = sum(total_violation_count),
    investigation_numbers = paste(unique(investigation_number), collapse = ", ")
  ) |>
  arrange(desc(total_violations))
`summarise()` has grouped output by 'regulated_entity_name'. You can override
using the `.groups` argument.entity_count# A tibble: 25,811 × 4
# Groups: regulated_entity_name [25,474]
regulated_entity_name county total_violations investigation_numbers
<chr> <chr> <dbl> <chr>
1 PORT ARTHUR REFINERY JEFFE… 943 901402, 923838, 9123…
2 BLANCHARD REFINING GALVESTON B… GALVE… 693 880047, 906279, 9057…
3 DOW TEXAS OPERATIONS FREEPORT BRAZO… 667 864696, 887741, 8580…
4 CHEVRON PHILLIPS CHEMICAL CEDA… HARRIS 545 877580, 936808, 8997…
5 CHOCOLATE BAYOU PLANT BRAZO… 517 942453, 981710, 9706…
6 INV NYLON CHEMICALS AMERICAS V… VICTO… 419 895156, 912649, 9211…
7 COVESTRO INDUSTRIAL PARK BAYTO… CHAMB… 401 880186, 900040, 9000…
8 EXXONMOBIL BAYTOWN REFINERY HARRIS 389 865475, 880706, 8773…
9 INV NYLON CHEMICALS AMERICAS O… ORANGE 368 895472, 914893, 9156…
10 BASF FREEPORT SITE BRAZO… 367 877759, 919651, 9521…
# ℹ 25,801 more rowsData Takeaway: The Port Arthur Refinery has received the most environmental violations in Texas since 2010, with 943 notices. As the third-largest fuel, petrochemical, and heavy sour crude oil processing platform in the U.S., it has faced allegations such as leaving universal waste containers open, delaying cleanup of hydrocarbon spills near a loading rack, and failing to post required safety signs at waste management areas. Most recently, it was cited for failing to prevent unauthorized atmospheric emissions in July 2024.
Another crude oil refinery in Galveston takes second place, with a total of 693 notices. The Galveston Bay Refinery was recently cited for failing to prevent unauthorized atmospheric emissions, conducting sampling for air contaminants at the sulfur recovery unit, and performing a repair attempt for a closed vent system.
Corrective actions for both companies include adjusting operational procedures for the equipment and training personnel.
Now, I want to see the top emitters in Travis County, where UT Austin is nested.
travis_entity_count <- nov_clean |>
  filter(county == "TRAVIS") |>
  group_by(regulated_entity_name) |>
  summarize(total_violations = sum(total_violation_count),
            investigation_numbers = paste(unique(investigation_number), collapse = ", ")
            ) |>
  arrange(desc(total_violations))

travis_entity_count
# A tibble: 392 × 3
regulated_entity_name total_violations investigation_numbers
<chr> <dbl> <chr>
1 CITY OF PFLUGERVILLE 54 1603954
2 WALNUT CREEK WASTEWATER TREATMENT PLA… 28 957528, 969067, 1085…
3 LAKE POINTE WWTP 21 970169, 1077094, 125…
4 BRIAR CREEK WWTP 20 995595, 1085055, 135…
5 AUSTIN WHITE LIME MCNEIL PLANT & QUAR… 18 1138295, 1138860, 13…
6 NAMELESS HOLLOW CONDOMINIUMS 17 1058060, 1288218, 13…
7 SALAS HOLDINGS 17 1101922, 1692725
8 LAKESIDE UTIL 14 1001707, 1266221, 15…
9 RANGE AT AUSTIN 14 1610014
10 CITY OF LAGO VISTA WWTP 13 1106339, 1221756, 14…
# ℹ 382 more rowsData Takeaway: The top environmental violator in Travis County is the City of Pflugerville, totaling 54 notices. In January 2019, the city’s water treatment plant violated cryptosporidium removal requirements, falling short of minimum treatment standards. Cryptosporidium is a microscopic parasite commonly found in water sources contaminated with fecal matter. Its removal requirements are mandated by the Environmental Protection Agency (EPA) to ensure safe drinking water for the public.
The second most cited entity in Travis County is a wastewater treatment plant in Walnut Creek, accounting for 28 notices. According to the TCEQ, the entity failed to properly operate and maintain its facility, being cited for severely rusted and eroded catwalks in the primary treatment area. Additionally, it failed to prevent the discharge of visible foam beyond trace amounts and persistent frothing in November 2022.
Do the violations vary by county? I will aggregate all individual county appearances to find out.
county_violations <- citations_clean |>
  group_by(county) |>
  summarize(
    total_violations = n()) |>
  arrange(desc(total_violations)) |>
  head(10)

county_violations
# A tibble: 10 × 2
county total_violations
<chr> <int>
1 HARRIS 28179
2 JEFFERSON 8633
3 BRAZORIA 6812
4 NUECES 4962
5 MONTGOMERY 4931
6 ORANGE 4512
7 HIDALGO 4066
8 TARRANT 3891
9 EL PASO 3826
10 GALVESTON 3581Data Takeaway: Harris County takes the lead in the number of entities cited for environmental violations since 1998, with over 28,179 citations released in total. Jefferson County takes a distant second with 8,633 notices.
I can also visualize this data in a bar chart. I referred to Nathan Yau’s Data Points textbook to find the graph type that would be the best fit to the display this information. I also used the ggplot function reference to make it aesthetically pleasing.
ggplot(county_violations,
       aes(y = reorder(county, total_violations), x = total_violations)) +
  geom_col() +
  geom_text(aes(label = total_violations), hjust = 1.1, color = "white") +
  labs(
    title = "Who’s polluting Texas? Harris County takes the lead",
    subtitle = str_wrap("Harris County has the highest number of entities cited for environmental violations since 1998, according to data from the Texas Commission on Environmental Quality, with over 28,179 citations handed out in total. Jefferson County is a distant second."),
    caption = "By Angelica Ruzanova",
    x = "Total violations",
    y = "County"
  ) +
  theme_minimal()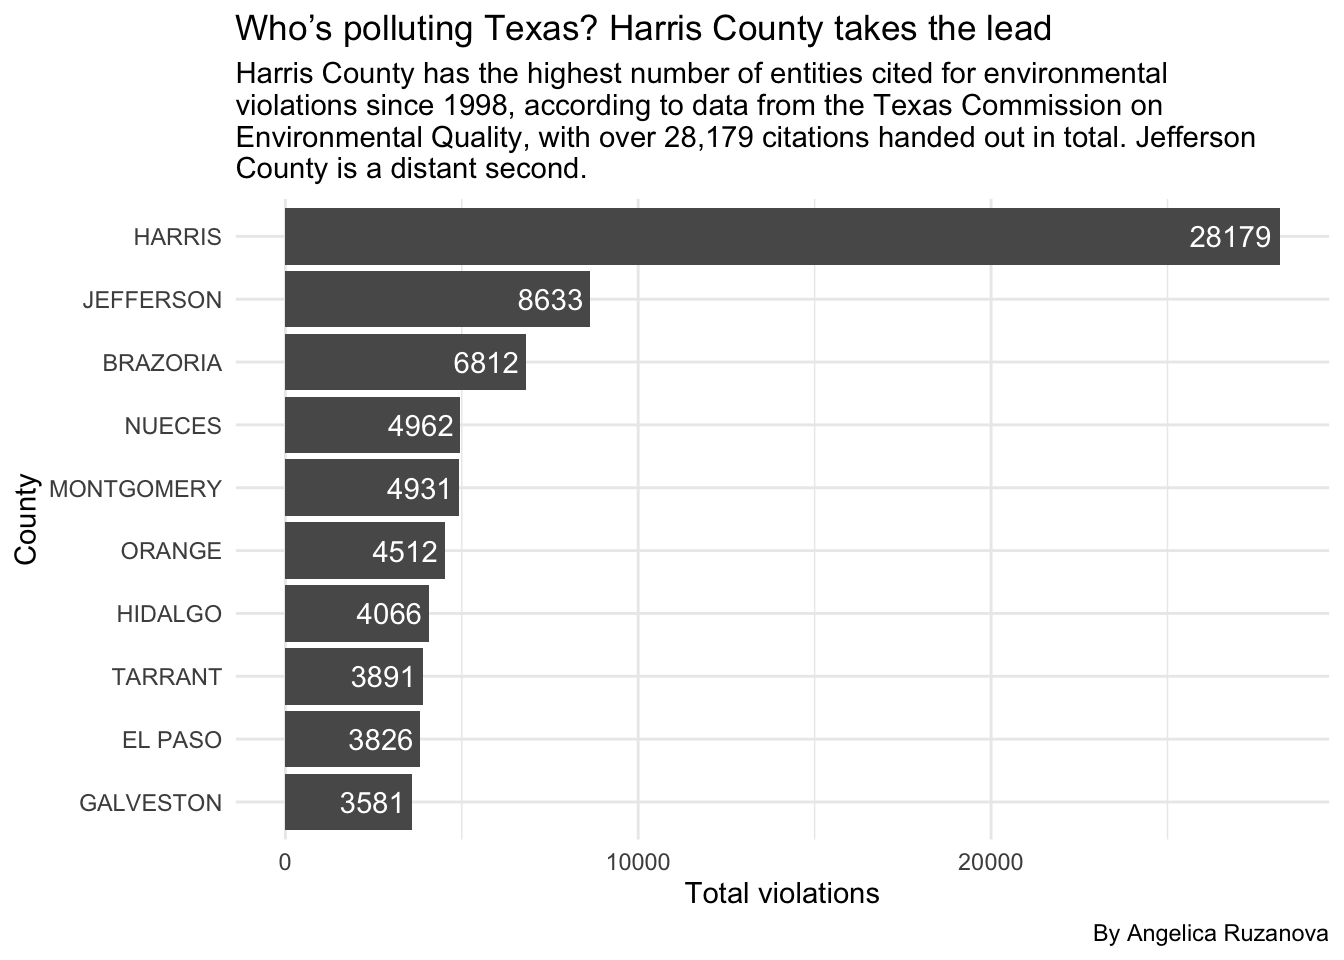
To create a choropleth map on Datawrapper, I am going to download a csv file with all county names.
county_violations_all <- citations_clean |>
  group_by(county) |>
  summarize(total_violations = n()) |>
  arrange(desc(total_violations))

county_violations_all |> write_csv("data_processed/01-county-violations-all.csv")
The finished, ready-to-publish map can be found here: https://datawrapper.dwcdn.net/GLOGc/1/
Harris County - a closer look
Considering the enormous gap that Harris County has with other counties, it would be worth taking a look at its top emitters separately. Using the same logic, I will group, summarize and arrange the filtered county.
harris_top_emitters <- nov_clean |>
  filter(county == "HARRIS") |>
  group_by(regulated_entity_name) |>
  summarize(total_violations = sum(total_violation_count),
            investigation_numbers = paste(unique(investigation_number), collapse = ", ")
            ) |>
  arrange(desc(total_violations))

harris_top_emitters
# A tibble: 2,685 × 3
regulated_entity_name total_violations investigation_numbers
<chr> <dbl> <chr>
1 CHEVRON PHILLIPS CHEMICAL CEDAR BAYOU… 545 877580, 936808, 8997…
2 EXXONMOBIL BAYTOWN REFINERY 389 865475, 880706, 8773…
3 SHELL DEER PARK CHEMICALS 356 878837, 901124, 8998…
4 PASADENA REFINING SYSTEM PRSI 297 968337, 965148, 9705…
5 LUBRIZOL DEER PARK 292 922552, 958467, 9815…
6 HOUSTON REFINING 240 885439, 957213, 9964…
7 HOUSTON PLANT 222 952341, 989856, 1050…
8 PASADENA PLASTICS COMPLEX 213 870371, 906737, 9227…
9 INEOS POLYETHYLENE NORTH AMERICA LA P… 205 950851, 957649, 1094…
10 EQUISTAR CHEMICALS CHANNELVIEW COMPLEX 197 879378, 949428, 9702…
# ℹ 2,675 more rowsData Takeaway: The Chevron Phillips chemical plant in Harris County, Texas - home to the state’s highest number of environmental violations - leads the number of environmental citations in the county. Its Cedar Bayou facility has received 545 notices, including violations for failing to detect a rail car leak and prevent unauthorized emissions.
An ExxonMobil refinery in Baytown comes second with 389 violation citations, example of which include exceeding the hydrogen sulfide and nitrogen oxide emissions within the daily cap and leaving open-ended lines.
Trends by year
Policy and technological breakthroughs impact the rate at which environmental violations may occur, so it would be interesting to look at the data on a yearly basis. This can be accomplished with the same GSA method and a new column that extracts the year.
citations_clean_year <- citations_clean |>
  mutate(year = year(investigation_approved_date))
Now onto grouping by year to see the trends.
year_trends <- citations_clean_year |>
  group_by(year) |>
  summarize(
    total_violations = n()) |>
  arrange(desc(total_violations))

year_trends
# A tibble: 27 × 2
year total_violations
<dbl> <int>
1 2019 20803
2 2023 19343
3 2022 18695
4 2024 18246
5 2017 17905
6 2016 17704
7 2020 17657
8 2018 17474
9 2021 17321
10 2015 16602
# ℹ 17 more rowsData Takeaway: Within the last 27 years, 2019 comes on top with the number of environmental violation notices handed out to entities in Texas, with a total of 20,803 citations that year alone. The year 2023 comes as a close second, with 19,343 citations.
Trends in Greater Austin
A line chart would help visualize these trends, filtered to only show counties in the Greater Austin area over the last 15 years.
The process starts with filtering and creating a new object.
county_trends <- citations_clean_year |>
  filter(
    (county == "BASTROP" | county == "TRAVIS" | county == "CALDWELL" | county == "COMAL" | county == "GUADALUPE" | county == "HAYS" | county == "BEXAR") &
    year > 2010 & year < 2024
    ) |>
  group_by(year, county) |>
  summarize(total_violations = n())
`summarise()` has grouped output by 'year'. You can override using the
`.groups` argument.county_trends# A tibble: 91 × 3
# Groups: year [13]
year county total_violations
<dbl> <chr> <int>
1 2011 BASTROP 26
2 2011 BEXAR 125
3 2011 CALDWELL 7
4 2011 COMAL 17
5 2011 GUADALUPE 10
6 2011 HAYS 28
7 2011 TRAVIS 94
8 2012 BASTROP 31
9 2012 BEXAR 149
10 2012 CALDWELL 10
# ℹ 81 more rowsAnd then plotting it. This is my second publishable chart for the final report.
ggplot(county_trends,
       aes(x = year, y = total_violations, color = county)) +
  geom_point() +
  geom_line(size = 0.5, aes(color = county)) +
  scale_x_continuous(breaks = 2010:2023) +
  labs(
    title = str_wrap("Keep Austin Green: Environmental violations peak in 2019"),
    subtitle = str_wrap("Environmental violations in Greater Austin counties peaked in 2019 with 770 notices issued to businesses and entities, the highest total recorded since 2010 and consistent with statewide trends, according to Texas Commission on Environmental Quality data. Notices declined in the following years, potentially due to the COVID-19 pandemic, before rising sharply again in 2023 to 595."),
    caption = "By Angelica Ruzanova",
    x = "Year",
    y = "Total violations",
    color = "County"
  ) +
  theme_minimal()
Warning: Using `size` aesthetic for lines was deprecated in ggplot2 3.4.0.
ℹ Please use `linewidth` instead.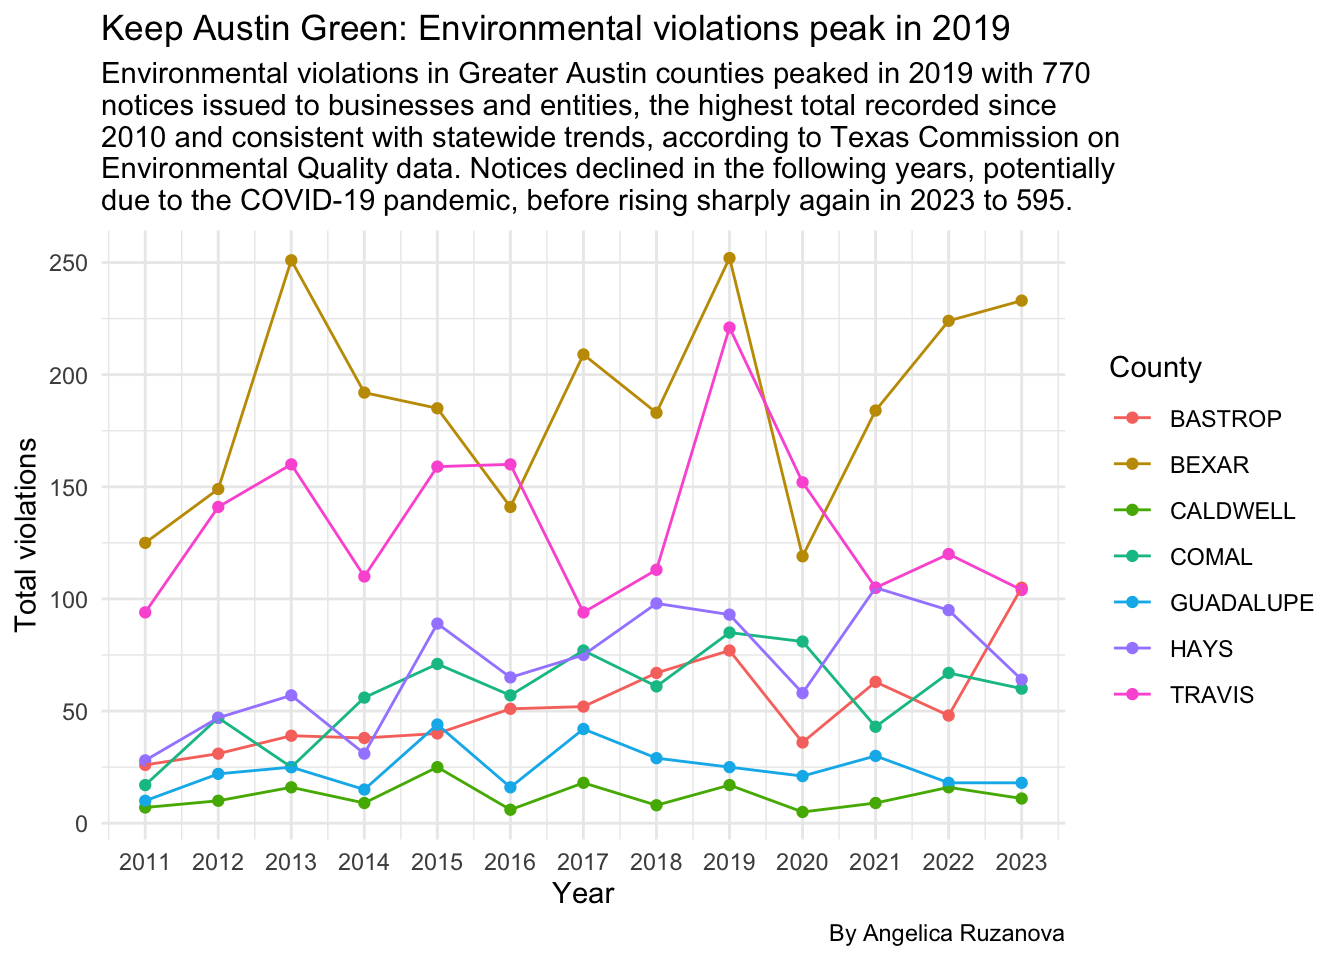
To enhance the graph labels, I will do another grouping to see which years are actually on top.
year_trends <- citations_clean_year |>
  filter(
    (county == "BASTROP" | county == "TRAVIS" | county == "CALDWELL" | county == "COMAL" | county == "GUADALUPE" | county == "HAYS" | county == "BEXAR") &
    year > 2010 & year < 2024
    ) |>
  group_by(year) |>
  summarize(
    total_violations = n()) |>
  arrange(desc(total_violations))

year_trends
# A tibble: 13 × 2
year total_violations
<dbl> <int>
1 2019 770
2 2015 613
3 2023 595
4 2022 588
5 2013 573
6 2017 567
7 2018 559
8 2021 539
9 2016 496
10 2020 472
11 2014 451
12 2012 447
13 2011 307Data Takeaway: In Greater Austin counties, 2019 marked the highest number of environmental violations (770), making it a standout year. It was followed by a decline in violations, potentially due to the COVID-19 pandemic, with a returning spike in 2023 at 595 notices.
To use the chart in my summary, I will save it as a png.
saved_county_line <- ggplot(county_trends,
       aes(x = year, y = total_violations, color = county)) +
  geom_point() +
  geom_line(size = 0.5, aes(color = county)) +
  scale_x_continuous(breaks = 2010:2023) +
  labs(
    title = str_wrap("Keep Austin Green: Environmental violations peak in 2019"),
    subtitle = str_wrap("Environmental violations in Greater Austin counties peaked in 2019 with 770 notices issued to businesses and entities, the highest total recorded since 2010 and consistent with statewide trends, according to Texas Commission on Environmental Quality data. Notices declined in the following years, potentially due to the COVID-19 pandemic, before rising sharply again in 2023 to 595."),
    caption = "By Angelica Ruzanova",
    x = "Year",
    y = "Total violations",
    color = "County"
  ) +
  theme_minimal()

ggsave("figures/county-line.png")
Saving 7 x 5 in imageFrequency by category
Now, I am curious about the general category appearances. Their definitions are as follows:
Category A violations require automatic initiation of formal enforcement action when documented during an investigation.
Category B violations trigger a NOV at the first occurrence, with formal enforcement if not corrected by deadline or if repeated within two consecutive investigations in a five-year period, unless an extension is approved.
Category C violations may lead to formal enforcement if the same violation occurs three times within a five-year period, with decisions on enforcement made by staff management.
category_count <- citations_clean |>
  group_by(violation_category) |>
  summarize(category_count = n()) |>
  arrange(desc(category_count))

category_count
# A tibble: 3 × 2
violation_category category_count
<chr> <int>
1 B 154745
2 C 84935
3 A 1345Data Takeaway: Category B environmental violations - those that require formal enforcement action if the violation is not corrected by an established deadline - appear almost double the amount than Category C and A combined, with 154,745 in total since 1998 in Texas.
So, which county has the most Category A violations in Texas? This can be found by grouping the counties within the filtered category.
category_a_county <- citations_clean |>
  filter(violation_category == "A") |>
  group_by(county) |>
  summarize(category_a_count = n()) |>
  arrange(desc(category_a_count))

category_a_county
# A tibble: 175 × 2
county category_a_count
<chr> <int>
1 MIDLAND 131
2 LUBBOCK 83
3 HARRIS 48
4 ECTOR 44
5 TARRANT 35
6 GILLESPIE 34
7 CAMERON 33
8 GALVESTON 29
9 DALLAS 27
10 MARTIN 25
# ℹ 165 more rowsMost Category A violations per entity award goes to…
category_a_entity <- nov_clean |>
  filter(!is.na(cat_a_violation_citations)) |>
  group_by(regulated_entity_name) |>
  summarize(total_cat_a_citations = n_distinct(cat_a_violation_citations)) |>
  arrange(desc(total_cat_a_citations))

category_a_entity
# A tibble: 746 × 2
regulated_entity_name total_cat_a_citations
<chr> <int>
1 BLANCHARD REFINING GALVESTON BAY REFINERY 4
2 GREENWOOD VENTURES 4
3 LAKEWOOD WATER SYSTEM 4
4 CITY OF PAINT ROCK 3
5 CLEAR CREEK RESORT WATER SYSTEM 3
6 ELM GROVE MOBILE HOME PARK 3
7 FORT JACKSON MOBILE ESTATES 3
8 GREEN HILLS SUBDIVISION 3
9 JAMES LAKE GAS PLANT 3
10 KING RANCH GAS PLANT 3
# ℹ 736 more rowsData Takeaway: Midland, a Texas county halfway between Fort Worth and El Paso, contains entities with the highest number of Category A environmental violations, totaling 131 since 1998.
Marathon Petroleum, Greenwood Ventures and the Lakewood Water System are tied for the top spot for Category A violations by entity, each totaling 4 citations since 2010. Category A can be considered more severe due to a lower due diligence threshold.
As far as year-by-year trends of how the categories are changing, I can pivot wider to add new columns and arrange based on the category of interest.
citations_clean_year |>
  group_by(year, violation_category) |>
  summarize(violation_count = n()) |>
  pivot_wider(
    names_from = violation_category,
    values_from = violation_count
    ) |>
  arrange(desc(A))
`summarise()` has grouped output by 'year'. You can override using the
`.groups` argument.# A tibble: 27 × 4
# Groups: year [27]
year B C A
<dbl> <int> <int> <int>
1 2011 7776 4249 241
2 2024 11704 6339 203
3 2023 13013 6211 119
4 2013 9788 5316 113
5 2019 12806 7900 97
6 2022 11378 7233 84
7 2018 11852 5539 83
8 2014 10347 5604 76
9 2020 10608 6978 71
10 2021 10596 6675 50
# ℹ 17 more rowsData Takeaway: When it comes to Category A environmental violations - or those that require automatic action when documented during an investigation - 2011 takes the lead with 241 handed out to Texas agencies. Although the data is incomplete, 2024 comes as a close second with 203.
In-depth by industry
Given that we have two complimentary sets, we can also find out which industries come out on top by doing some grouping and summarizing. I excluded the unnamed columns.
industry_count <- nov_clean |>
  group_by(business_type) |>
  summarize(
    total_violations = n()) |>
  filter(!is.na(business_type)) |>
  arrange(desc(total_violations))

industry_count
# A tibble: 4,094 × 2
business_type total_violations
<chr> <int>
1 RETAIL 7115
2 DOMESTIC 4257
3 INDUSTRIAL CHEMICAL MANUFACTURING PLANT 1735
4 WATER SUPPLY 1630
5 PUBLIC WATER SUPPLY 1339
6 FLEET REFUELING 1265
7 INDUSTRIAL 465
8 MOBILE HOME PARK 370
9 OIL AND GAS PRODUCTION 364
10 PUBLIC WATER SYSTEM 298
# ℹ 4,084 more rowsIt seems this data was manually typed by TCEQ employees, so some of the rows repeat due to naming differentiation. I used Claude LLM to help me sort some of the business types into broader industries. Then, I manually entered names that were misspelled, abbreviated, or unclassified by the model.
I will begin by applying categorizations based on identified keywords (with normalized capitalization). This needs to be manually checked.
industry_count <- nov_clean |>
  mutate(
    business_type = toupper(business_type),
    industry = case_when(
      grepl("MOBILE HOME|RV PARK|TRAILER PARK|CAMP|MANUFACTURED HOUSING|MHP|R V PARK|RECREATIONAL VEHICLE PARK|HOME PARK|MOBILE HOME COMPLEX", business_type) ~ "Mobile Home Parks",
      grepl("REFIN|CHEMICAL|MANUFACTURING|PETROLEUM|PROPYLENE PRODUCTION|PRODUCTION OF ACRYLIC AND METHACRYLIC MONOMERS|BULK LIQUID STORAGE TERMINAL|POLYETHYLENE|POLYPROPYLENE|ETHYLENE|PROPYLENE|BENZENE|BUTADIEN|FOR HIRE LIQUID STORAGE AND TRANSFER|SYNTHETIC RUBBER|EURECAT|ZEOLITE|ACRYLIC ACID|ESTERS|ACETIC ACID|MERCAPTANS|SULFIDES|COKE|RESIN|AMMONIA|BULK STORAGE|POLY CATALYST|SODIUM CHROMATEOIL|GAS|DRILLING|EXPLORATION|WELL|TANK BATTERY|CRUDE OIL|SODIUM CHROMATE|ACETATE|PROPLYLENE|TRENCH BURNER|CHEMCIALS|FUEL|GLYCINE|PEROXIDES", business_type) ~ "Petroleum & Chemical Manufacturing",
      grepl("CONSTRUCTION|BUILDING|BRIDGE|EXCAVATION|SITE|CONCRETE|ROCK CRUSHING|SES|SAND|HOMEBUILDER|BASE|INDUSTRIAL|STEEL|GLASS|RUBBER|PULP|LUMBER|WOOD|IRON|METAL|ASPHALT|MINING|PREVENTERS|ROCK", business_type) ~ "Construction & Industrial",
      grepl("WASTE|RECYCLING|COMPOSTING|HAZARDOUS|DISPOSAL|SLUDGE TRANSPORTER|DISCHARGE", business_type) ~ "Waste",
      grepl("WATER|WASTEWATER|IRRIGATION|TREATMENT|PWS", business_type) ~ "Water Management",
      grepl("POWER|ELECTRIC|GENERATION|SOLAR|WIND", business_type) ~ "Energy Generation",
      grepl("RETAIL|SHOP|GROCERY STORE|ATHLETIC|CONVENIENCE STORE|TECHNOLOGY|AUTO|CAR|COMMERCIAL", business_type) ~ "Retail",
       grepl("DOMESTIC|RESIDENTIAL|RESIDENCE", business_type) ~ "Domestic Services",
      grepl("TRANSPORTATION|FLEET|TRUCKING|AIRCRAFT REFUELING|MARINA|MARINE", business_type) ~ "Transportation",
      grepl("AGRICULTURE|FARM|CROP|LIVESTOCK|FOOD|COFFEE|MEAT|POULTRY|SEAFOOD|DAIRY|MILK|EGG|SHRIMP|GRAIN|ELEVATOR|RESTAURANT|WHOLESALE|AGRICULTURAL|COTTON|BEEF", business_type) ~ "Agriculture",
      grepl("PRIVATE|LAND|PROPERTY|TRACT|CLEARING|DEVELOPMENT|APARTMENTS", business_type) ~ "Land Use",
      grepl("GOVERNMENT|MUNICIPAL|UTILITY|PUBLIC|CHURCH|DAY CARE|STATE PARK|CORRECTIONAL INSTITUTION|RECREATIONAL PARK|SCHOOL|RESEARCH|PATROL|CLEBURNE|NAVAL|HOSPITAL|STATE OWNED", business_type) ~ "Government and Public Services",
      TRUE ~ "Other")
  ) |>
  group_by(industry) |>
  summarize(total_violations = n()) |>
  arrange(desc(total_violations))

industry_count
# A tibble: 13 × 2
industry total_violations
<chr> <int>
1 Other 30134
2 Petroleum & Chemical Manufacturing 9865
3 Retail 7726
4 Water Management 5527
5 Domestic Services 5145
6 Construction & Industrial 3025
7 Mobile Home Parks 1224
8 Agriculture 990
9 Government and Public Services 591
10 Waste 496
11 Land Use 409
12 Energy Generation 319
13 Transportation 184This is where I view the “Other” category and manually analyze the names, including them with the other industries where appropriate:
other_category_data <- nov_clean |>
  mutate(
    business_type = toupper(business_type),
    industry = case_when(
      grepl("MOBILE HOME|RV PARK|TRAILER PARK|CAMP|MANUFACTURED HOUSING|MHP|R V PARK|RECREATIONAL VEHICLE PARK|HOME PARK|MOBILE HOME COMPLEX", business_type) ~ "Mobile Home Parks",
      grepl("REFIN|CHEMICAL|MANUFACTURING|PETROLEUM|PROPYLENE PRODUCTION|PRODUCTION OF ACRYLIC AND METHACRYLIC MONOMERS|BULK LIQUID STORAGE TERMINAL|POLYETHYLENE|POLYPROPYLENE|ETHYLENE|PROPYLENE|BENZENE|BUTADIEN|FOR HIRE LIQUID STORAGE AND TRANSFER|SYNTHETIC RUBBER|EURECAT|ZEOLITE|ACRYLIC ACID|ESTERS|ACETIC ACID|MERCAPTANS|SULFIDES|COKE|RESIN|AMMONIA|BULK STORAGE|POLY CATALYST|SODIUM CHROMATEOIL|GAS|DRILLING|EXPLORATION|WELL|TANK BATTERY|CRUDE OIL|SODIUM CHROMATE|ACETATE|PROPLYLENE|TRENCH BURNER|CHEMCIALS|FUEL|GLYCINE|PEROXIDES", business_type) ~ "Petroleum & Chemical Manufacturing",
      grepl("CONSTRUCTION|BUILDING|BRIDGE|EXCAVATION|SITE|CONCRETE|ROCK CRUSHING|SES|SAND|HOMEBUILDER|BASE|INDUSTRIAL|STEEL|GLASS|RUBBER|PULP|LUMBER|WOOD|IRON|METAL|ASPHALT|MINING|PREVENTERS|ROCK", business_type) ~ "Construction & Industrial",
      grepl("WASTE|RECYCLING|COMPOSTING|HAZARDOUS|DISPOSAL|SLUDGE TRANSPORTER|DISCHARGE", business_type) ~ "Waste",
      grepl("WATER|WASTEWATER|IRRIGATION|TREATMENT|PWS", business_type) ~ "Water Management",
      grepl("POWER|ELECTRIC|GENERATION|SOLAR|WIND", business_type) ~ "Energy Generation",
      grepl("RETAIL|SHOP|GROCERY STORE|ATHLETIC|CONVENIENCE STORE|TECHNOLOGY|AUTO|CAR", business_type) ~ "Retail",
       grepl("DOMESTIC|RESIDENTIAL|RESIDENCE", business_type) ~ "Domestic Services",
      grepl("TRANSPORTATION|FLEET|TRUCKING|AIRCRAFT REFUELING|MARINA|MARINE", business_type) ~ "Transportation",
      grepl("AGRICULTURE|FARM|CROP|LIVESTOCK|FOOD|COFFEE|MEAT|POULTRY|SEAFOOD|DAIRY|MILK|EGG|SHRIMP|GRAIN|ELEVATOR|RESTAURANT|WHOLESALE|AGRICULTURAL|COTTON|BEEF", business_type) ~ "Agriculture",
      grepl("PRIVATE|LAND|PROPERTY|TRACT|CLEARING|DEVELOPMENT", business_type) ~ "Land Use",
      grepl("GOVERNMENT|MUNICIPAL|UTILITY|PUBLIC|CHURCH|DAY CARE|STATE PARK|CORRECTIONAL INSTITUTION|RECREATIONAL PARK|SCHOOL|RESEARCH|PATROL|CLEBURNE|NAVAL|HOSPITAL|STATE OWNED", business_type) ~ "Government and Public Services",
      TRUE ~ "Other")
  ) |>
  filter(industry == "Other") |>
  group_by(business_type) |>
  summarize(total_violations = n()) |>
  arrange(desc(total_violations))

other_category_data
# A tibble: 1,052 × 2
business_type total_violations
<chr> <int>
1 <NA> 28212
2 N/D 22
3 50000 17
4 GENTLEMEN'S CLUB 17
5 DUSTY ROAD 16
6 QUARRY 14
7 DANCE CLUB 13
8 RIVER RESORT 13
9 COMPRESSOR STATION 12
10 LPG STORAGE & TRANSFER 12
# ℹ 1,042 more rowsI still ended up with over 30,000 results under the “Other” section. This include businesses labeled Dusty Road (the only one that appears to be under it is the City of Cameron), Gentlemen’s Club and Children’s Home.
However, the other industries are now more accurate.
Data takeaway: Among the included industries, petroleum and chemical manufacturing businesses receive the most environmental quality violations in Texas, with 9,865 recorded in total since 2010. The retail industry comes second with 7,726 notices.
Let’s visualize this in a bar chart.
ggplot(industry_count,
       aes(x = reorder(industry, total_violations), y = total_violations)) +
  geom_bar(stat = "identity") +
  coord_flip() +
  labs(
    title = str_wrap("Money makes the world go 'round: Refinery industry receives leads environmental violations in Texas"),
    subtitle = str_wrap("Businesses in the petroleum and chemical manufacturing industry received 9,865 citations since 2010, according to data from the Texas Commission on Environmental Quality. Retailers come second, totaling 7,726 citations, which includes gas stations and grocery stores."),
    caption = "By Angelica Ruzanova",
    x = "Industry",
    y = "Total violations",
    fill = "Industry"
  ) +
  theme_minimal()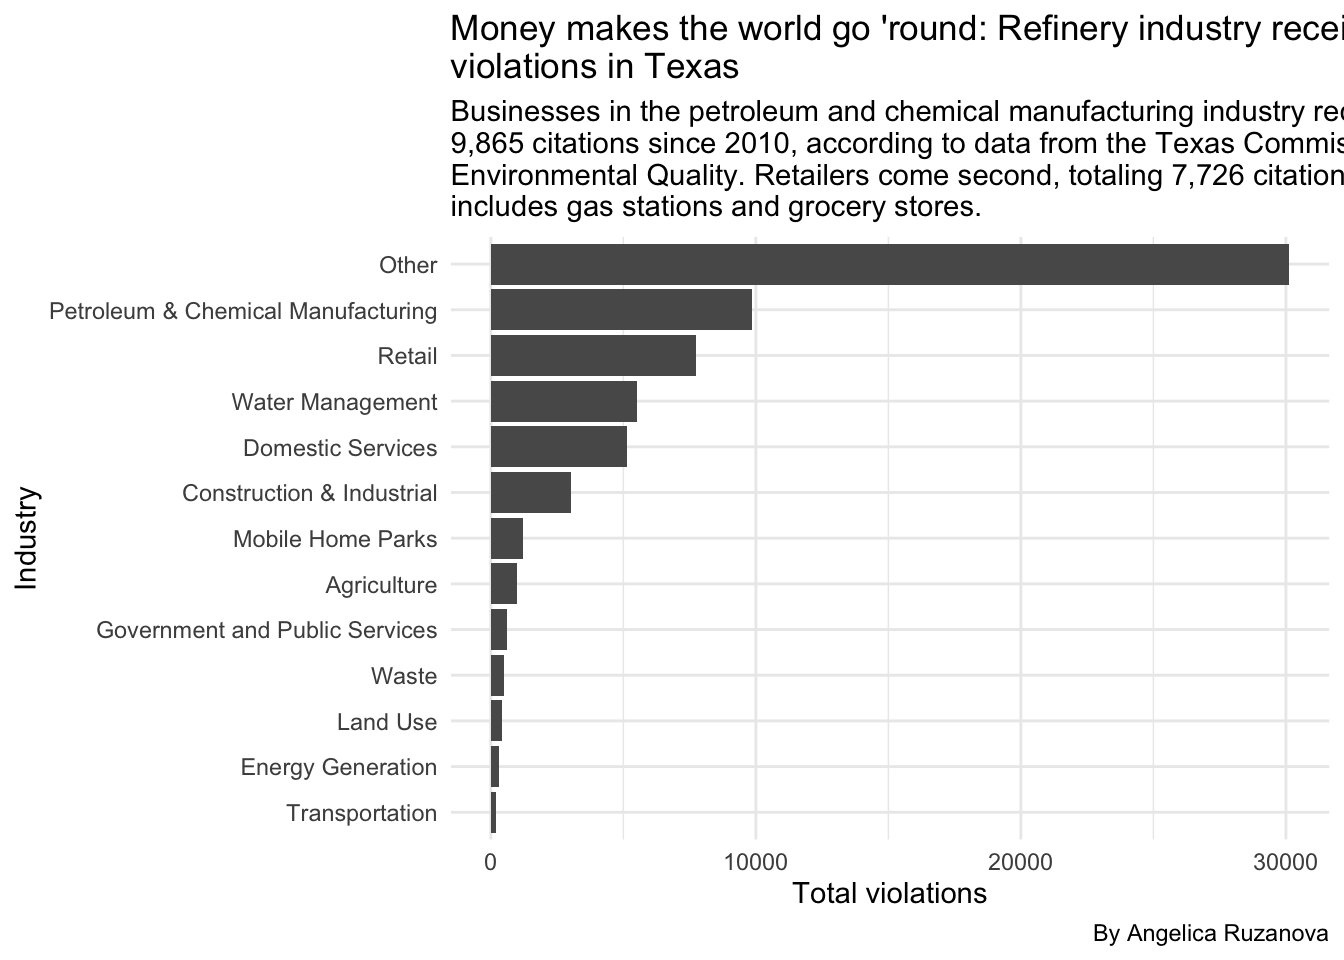
Allegations
I am curious what kinds of environmental allegations are most commonly cited, so I will group by violation_allegation to find out.
allegation_count <- citations_clean |>
  group_by(violation_allegation) |>
  summarize(count = n()) |>
  arrange(desc(count))

allegation_count
# A tibble: 104,277 × 2
violation_allegation count
<chr> <int>
1 Failure to meet the limit for one or more permit parameter 61607
2 NON-RPT VIOS FOR MONIT PER OR PIPE 4417
3 Failed to maintain compliance with the permitted effluent limits. 402
4 Failure to submit an annual registration renewal for a dry-cleaning fa… 323
5 Failed to prevent the unauthorized discharge of wastewater. 299
6 Failure to prevent the unauthorized discharge of wastewater. 260
7 Failure to provide records immediately upon request of agency personne… 256
8 Failed to ensure that the facility and all of its systems of collectio… 227
9 Failure to submit a Report of Surface Water Used for the previous cale… 216
10 Failure to provide amended registration for any change or additional i… 199
# ℹ 104,267 more rowsData Takeaway: The most common violation allegation from the TEQC is a “failure to meet the limit for one or more permit parameter,” cited 61,607 times since 1998. This refers to situations where a regulated entity does not comply with the specific limits set in their environmental permit, such as the amount of pollutants emitted, water quality standards, or other environmental criteria, according to the TEQC website.
Other commonly cited allegations are failures to report violations within the designated monitoring period, noncompliance with waste water limits, and issues with dry-cleaning facility registration renewals.